• Sign up
  • Log in
ABM – Machine Learning Platform for everyoneABM – Machine Learning Platform for everyoneABM – Machine Learning Platform for everyoneABM – Machine Learning Platform for everyone
  • How it works
  • Pricing
  • Developers
  • Blog
NextPrevious

Understanding machine learning #3: Confusion matrix – not all errors are equal

By Algolytics | Predictive models | Comments are Closed | 11 October, 2016 | 5

One of the most typical tasks in machine learning is classification tasks. It may seem that evaluating the effectiveness of such a model is easy. Let’s assume that we have a model which, based on historical data, calculates if a client will pay back credit obligations. We evaluate 100 bank customers and our model correctly guesses in 93 instances. That may appear to be  a good result – but is it really? Should we consider a model with 93% accuracy as adequate?

It depends. Today, we will show you a better way to evaluate prediction models.

Let’s come back to our example. The model was only wrong in 7 instances, however, its true quality depends on which instances. Let’s say that out of 100 clients, only 10 would not pay back. In this case, we can assume two scenarios:

  • Out of 7 errors, 6 will be a situation in which the person would pay back but was assumed not to pay and one instance is the reverse
  • Out of 7 errors, 6 will be a situation in which the person wouldn’t pay back but was assumed to pay and one instance is the reverse

Obviously, the second scenario is more costly to the bank, which suffered significant loss because it gave loans to people who didn’t manage to repay. To better explain this whole process, let’s introduce these terms:

  • Positives – are instances that have the value we are looking for when using a prediction model. Usually, they are less common values: for example, clients that actually buy our insurance or a client who will not pay back his loan.
  • Negatives – are instances that are more popular in the sample. For example, healthy people (when we are looking for sick ones) or clients who actually will buy our product (when we try to phone them).

Indeed, there are two categories of error: predicting a positive when the instance is negative and predicting a negative when the instance is positive. There are also two categories of good prediction; successful prediction is called true and unsuccessful false. As you can see, we now have 4 variants which form a tighter confusion matrix.

Let’s get back to our example. We have 100 loan clients.

Out of the 100, 10 will not pay back their loan (positives). However:

  1. We correctly identified 8. So in 8/10 instances we prevented loss [TRUE POSITIVES]
  2. We incorrectly identified 2. So in 2/10 instances we didn’t prevent loss [FALSE NEGATIVES]

The other 90 people paid back their loans (negatives). However:

  1. We correctly identified 85. So in 85/90 we gave a loan to people who paid us back [TRUE NEGATIVES]
  2. We incorrectly identified 5. So in 5/90 we didn’t give a loan to people who would pay us back. A loss but smaller than in the previous case. [FALSE POSITIVES]

This information in a table will form the confusion matrix.
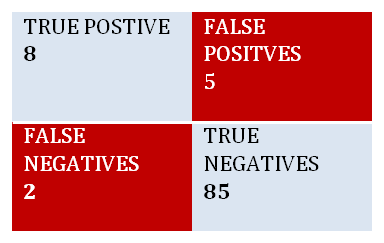
cm1When we sum it up (8+2+85+5), we get all of our 100 clients.

This method of evaluation is more meaningful, so let’s look next at a model taking into account concrete goals. How? We will write about it in our next blog in which we will discuss the cost matrix.


Want to read more news like this? Sign up for our Newsletter!

NAME

EMAIL

I agree to the processing of my personal data for the purpose of sending marketing information.

The administrator of the data given in the above form is Algolytics Technologies Sp. z o. o., ul. Przeskok 2, 00-032 Warszawa, NIP: 701-080-13-66, Regon: 369456263, District Court for the Capital City of Warsaw in Warsaw, XII Commercial Division of the National registered under KRS number 0000074723, Amount of the share capital: 321 300,00 PLN. Data is provided voluntarily and processed in order to respond to enquiries made using the form and to send marketing information. We would like to inform you about your right to be forgetten, your right to access the data and your right to correct it. Please note that your consent may be revoked at any time by sending an e-mail to gdpr@algolytics.pl from the address to which consent relates.

I accept Terms of service and Privacy policy

Read Terms of service

Read Privacy Policy

Share
Share7
Tweet
7 Shares
Predictive models

Algolytics

More posts by Algolytics

Related Post

  • correlation_causation_example1

    Correlation does not imply causation

    By Algolytics | Comments are Closed

    A popular phrase tossed around when we talk about statistical data is “there is correlation between variables”. However, many people wrongly consider this to be the equivalent of “there is causation between variables”. It’s importantRead more

  • Understanding machine learning #2: Do we need machine learning at all?

    By Algolytics | Comments are Closed

    In the previous post of our Understanding machine learning series, we presented how machines learn through multiple experiences. We also explained how, in some cases, human beings are much better at interpreting data than machines.Read more

  • Understanding Machine Learning #1 – How machines learn?

    By Algolytics | Comments are Closed

    “If (there) was one thing all people took for granted, (it) was conviction that if you feed honest figures into a computer, honest figures (will) come out. Never doubted it myself till I met aRead more

  • How to assess quality and correctness of classification models? Part 4 – ROC Curve

    By Algolytics | Comments are Closed

    In the previous parts of our tutorial we discussed: Basic notation used in assessing classification models Quantitative quality indicators Confusion Matrix In this fourth part of the tutorial we will discuss the ROC curve. WhatRead more

  • Tutorial: How to establish quality and correctness of classification models? Part 3 – Confusion Matrix

    By Algolytics | Comments are Closed

    In the previous parts of the tutorial (part 1, part 2) we introduced quantitative indicators of classification model quality. In the next two parts we will take a closer look at a couple of graphicalRead more

NextPrevious

100px white

Created with love by Algolytics

+48 691 303 305
abm_support (at) algolytics.com

Company

  • About us
  • Blog
  • Contact Us

Product

  • Documentation
  • Pricing
  • Terms of service
  • Privacy policy
  • API
Copyright © 2020 Algolytics Technologies | All Rights Reserved
  • How it works
  • Pricing
  • Developers
  • Blog
ABM – Machine Learning Platform for everyone
This site uses cookies: Find out more.